|
Many will turn to the "Trend Summaries" showing the Minimum, Maximum, and Average voltages and currents for each recorded interval over the recording period. The RMS of each cycle is measured with the Maximum trend shows the highest RMS recorded during each recording interval, the Minimum the lowest, and the Average the mean of the samples of that period.
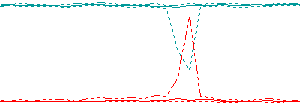
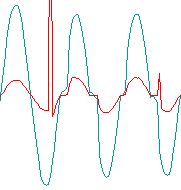
Shown above is a recording (captured on an Enetics' LM-5415) indicating significant drop in voltage accompanied by a large rise in current (voltage trace is represented in green, the current trace in red). It is not uncustomary to think that such a combination indicates a fault beyond the test point. Here the importance of waveform capture is shown. Concentrate first on the left hand capture below, this being taken from the entry in to the property closest to the 'point-of-problem' (the correct place to start!).
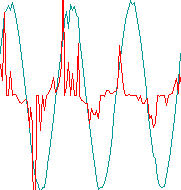
There are three cycles shown. The voltage on the second two is clearly seen to drop as well as becoming distorted. However, notice the current trace (red) too shows a similar characteristic to the voltage trace on the second two cycles being a flattening around the zero-crossing (ignoring the sharp 'pulse' on the first cycle for a moment). Concentrating now on the sharp spike at the end of the first cycle; Notice the phase angle of this high current draw is actually 180° to the incoming voltage indicating a large export of energy from the property rather than being in phase with the voltage i.e. showing a large import of energy as would be expected with a fault after the point of test. Combining the significant rise in anti-phase (180° out of phase) current indicating energy is being exported from the premises from e.g. power factor correction capacitors exported any charge they have into the short, as well as the current taking on the characteristics of the voltage waveform indicates the fault is prior to the point of test, and not beyond. The right hand capture is from a later recording done at the supply end of the cable feeding the premises. Again, in this capture the voltage is clearly seen to drop as the current increases, but without the zero-crossing distortion seen in the left-hand capture. Also, the current can now be seen to be clearly in phase with the voltage. In this capture, current transients are prevalent too (such transients are missing from the left-hand capture). These transients, in the order of hundreds of amps, are highly indicative of a short. Also, the transients are now generally in phase with the voltage therefore indicating energy is being imported by the feed cable. This is as would be expected by a short beyond the point of test. By comparing the two captures, one can now determine (as was the case) the feed cable to the premises has an intermittent fault (and may well include an intermittent short as well as an intermittent break, possibly in the same position). Interpreting Inrush Currents >>
© 25.11.04 |
 INTERPRETING THE READINGS:

